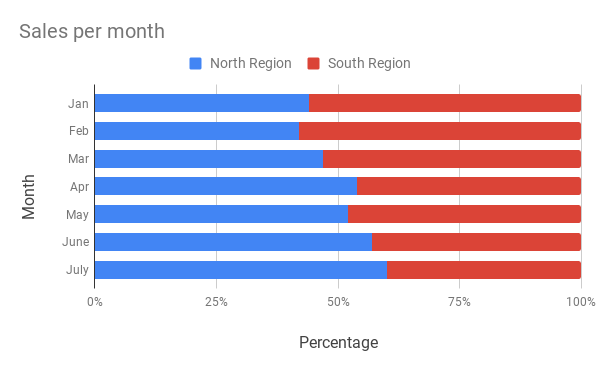
Spreadsheets are not very visually appealing, and its often difficult to see trends and comparisons, especially if there is a lot of data
We can use tabular data (ie the information in a spreadsheet) to produce highly visual charts to assimilate and explain our data

Creating, Inserting charts
VIDEOCONTENT8 Adding Series
- 14 minutes
- https://www.youtube.com/watch?v=DAU0qqh_I-A
- 0.00 inserting charts in Excel – automatically & manually
- 3.30 adjusting and enhancing chart elements for clarity.
- 7.45 adding multiple series to your charts
- create combination charts, like combining column and line charts
- making your charts more professional and visually appealing
- shortcuts and tools for efficient chart creation.
Editing your Chart
VIDEOCONTENT
- 5 minutes
- https://www.youtube.com/watch?v=xx4QtLnUW4U
- changing the data series
abstracting specific data cf the entire table - adding a heading
- formatting label text
- chart design, removing clutter